Last updated:
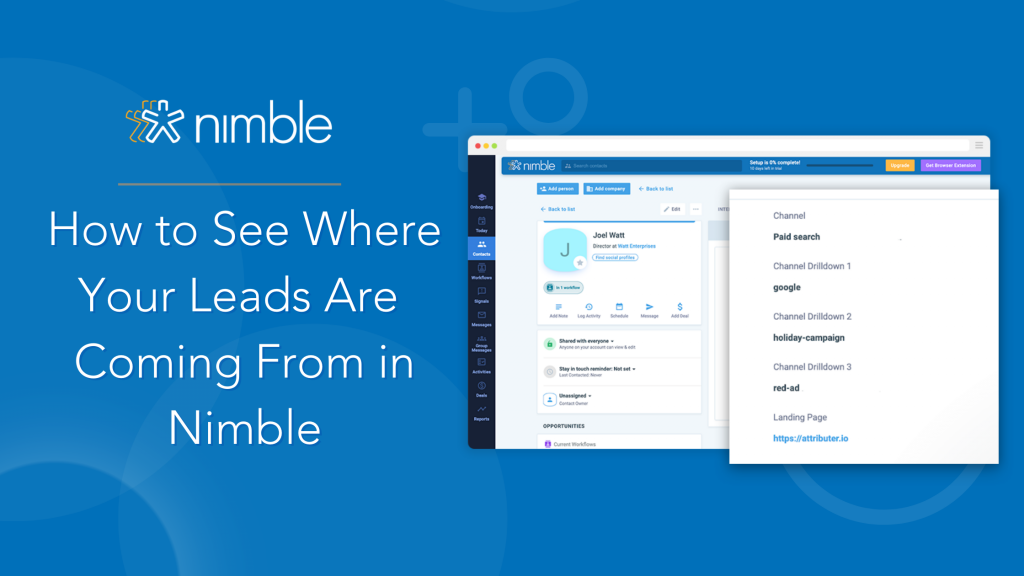
Do you know how many leads and customers you’re getting from your Google Ads? What about your Facebook Ads or SEO efforts?
Most businesses have tools like Google Analytics installed on their website, which allows them to see where their visitors are coming from, but don’t have that information flowing into their CRM to measure which of their marketing efforts are actually generating leads, customers, and revenue.

Image by vectorjuice on Freepik

If this sounds a little too familiar, then don’t worry because, in this post, we’re going to outline 3 simple steps that you can implement today to start seeing where each of your leads and customers has come from right within Nimble CRM.
Why It’s Important to Track Where Your Leads & Customers Are Coming From
Imagine you run a pool maintenance company and are doing SEO, Google Ads & Facebook Ads to attract new customers to your business.
If you were just using a tool like Google Analytics to measure visitors and goals, you’d probably get something like this:
|
SEO |
Facebook Ads |
Google Ads |
|
|
Spend |
$5,000 |
$5,000 |
$5,000 |
|
Visitors |
200 |
500 |
400 |
If this was the only information you had access to, then it would look like your Facebook Ads were performing the best. As a result, you’d probably start to spend more on those.
However, imagine if you could see the results all the way down to the number of customers and the amount of revenue generated. You’d have something like this:
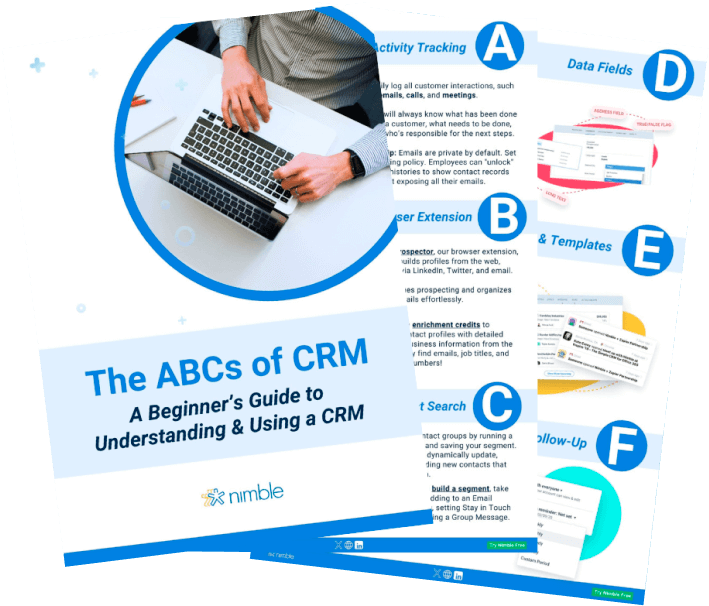
Free Guide
The ABCs of CRM
A Beginner's Guide to Understanding &
Using a CRM
Download Free
You’re All Set!
DownloadGet the most out of this guide by starting your free 14-day trial of Nimble today.
| SEO | Facebook Ads | Google Ads | |
|
Spend |
$5,000 |
$5,000 |
$5,000 |
|
Visitors |
200 |
500 |
400 |
|
Leads |
30 |
40 |
40 |
|
Customers |
25 |
7 |
12 |
| Revenue | $45,000 | $8,000 |
$18,000 |
Looking at the numbers above, you can see that actually, your SEO efforts are performing the best:
- You got more customers from SEO (25) than Google Ads and Facebook Ads combined (19)
- You got more revenue from SEO ($45,000) than Google Ads and Facebook Ads combined ($26,000)
- Your conversion rate from lead to a customer is higher for SEO (83%) than for your paid ads (17.5% for Facebook Ads and 30% for Google Ads)
When you’re able to track the performance of your various marketing initiatives down to the number of customers and the amount of revenue generated, you’re able to get the full picture of how they are performing and can allocate your budget accordingly.
3 Simple Steps to Track the Source of Your Leads & Customers in Nimble CRM
1. Add UTM Parameters to Your Ad Campaigns
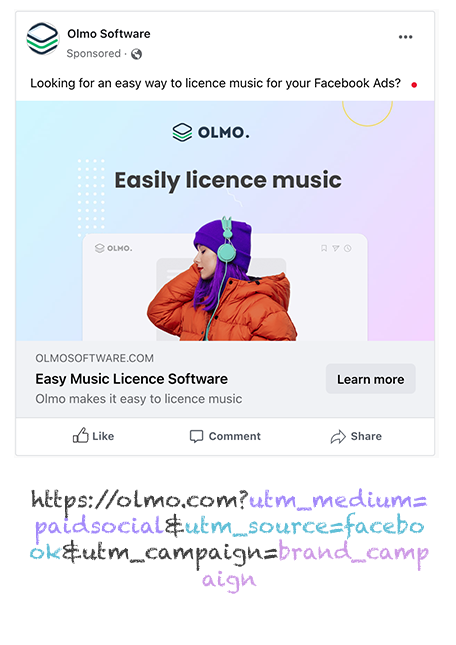
Firstly, you need to start by adding UTM parameters behind the various ad campaigns you’re running. This would include Google Ads, Facebook Ads, LinkedIn Ads, and anything else you might have going.
If you’re not familiar with UTM parameters, they’re essentially extra bits of text that you put at the end of the URL you send to people from your campaigns.
So let’s imagine the page you want to send someone is olmo.com. The final URL you send people would look something like this:
2. Implement a Lead-Tracking Tool
Lead tracking tools, like Attributer.io, are designed to pass marketing attribution information (like the fact a lead came from your Google Ads or Facebook Ads) into your CRM.
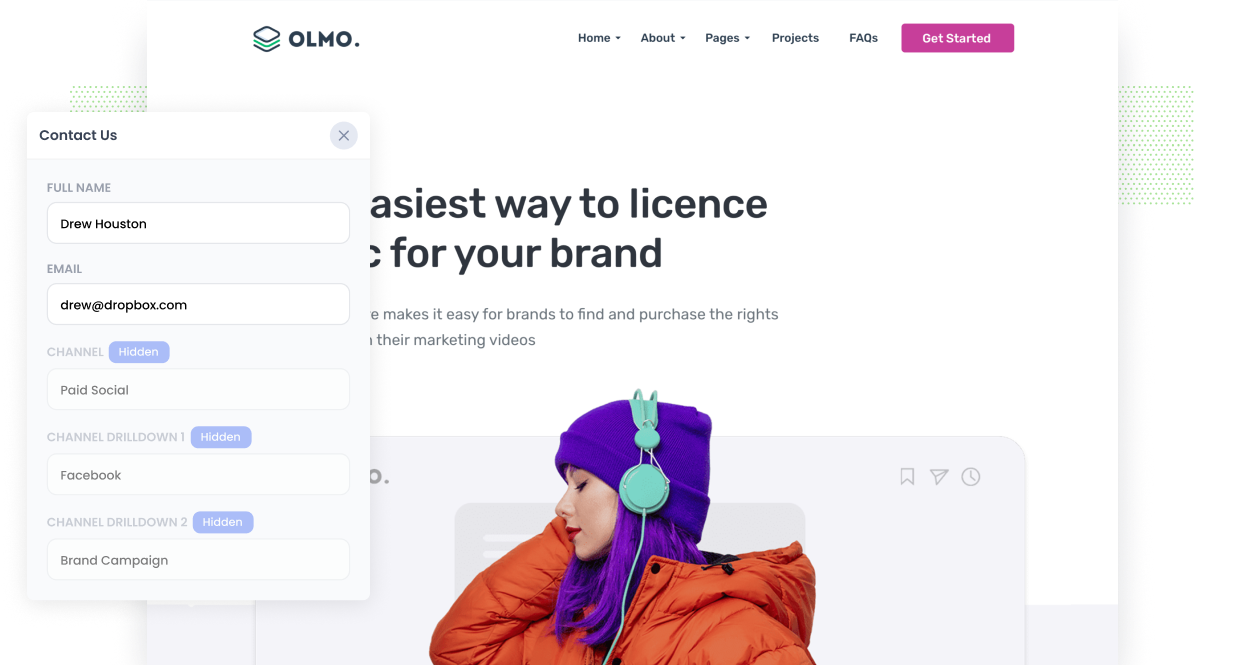
Setting them up is quite simple; you add a little snippet of code to your website and then place a few hidden fields on your forms. It works with nearly all CMS systems and form-builders.
When a visitor lands on your site, Attributer looks at how they got there and categorizes them into a set of channels (I.e. Paid Search, Paid Social, Organic Search, etc) before saving the data in a cookie in the visitor’s browser.
Finally, when the visitor completes a form on your site, Attributer writes the information about where they came from into the hidden fields, and it is captured alongside the lead’s name, email, etc.
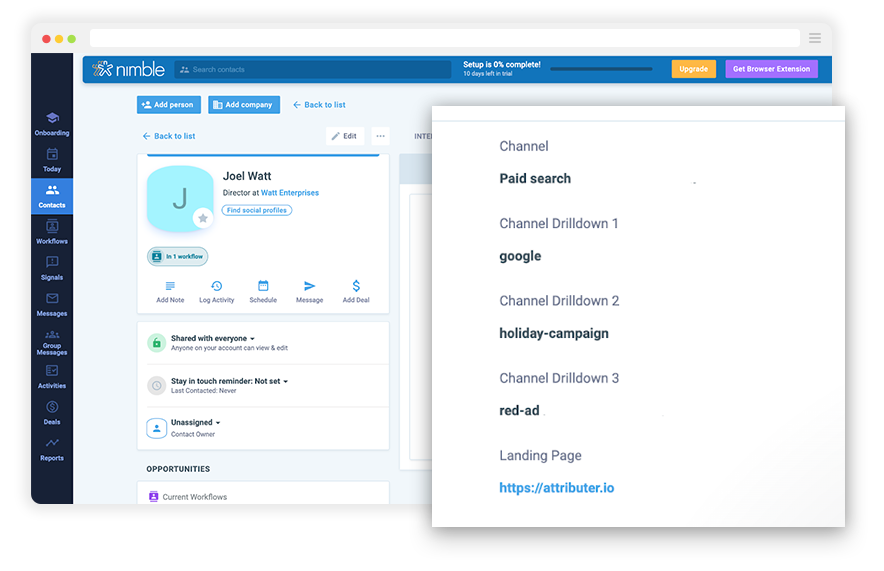
3. Send the Data to Nimble
Once the attribution information has been captured by your form tool, it can then be sent into Nimble alongside the lead’s name, email, company, etc.
How to do this will depend on what form tool you are using, but if you are using something like Gravity Forms then you can use an Add-On to automatically send new form submissions straight into Nimble CRM
Alternatively, there are integration tools like Zapier and Make which can connect virtually any form tool to Nimble and automatically create new contacts when a form is submitted on your website (complete with the marketing attribution information captured in your form tool).
4 Example Reports You Can Run to Understand Where Your Leads & Customers Are Coming From
1. Leads by Channel
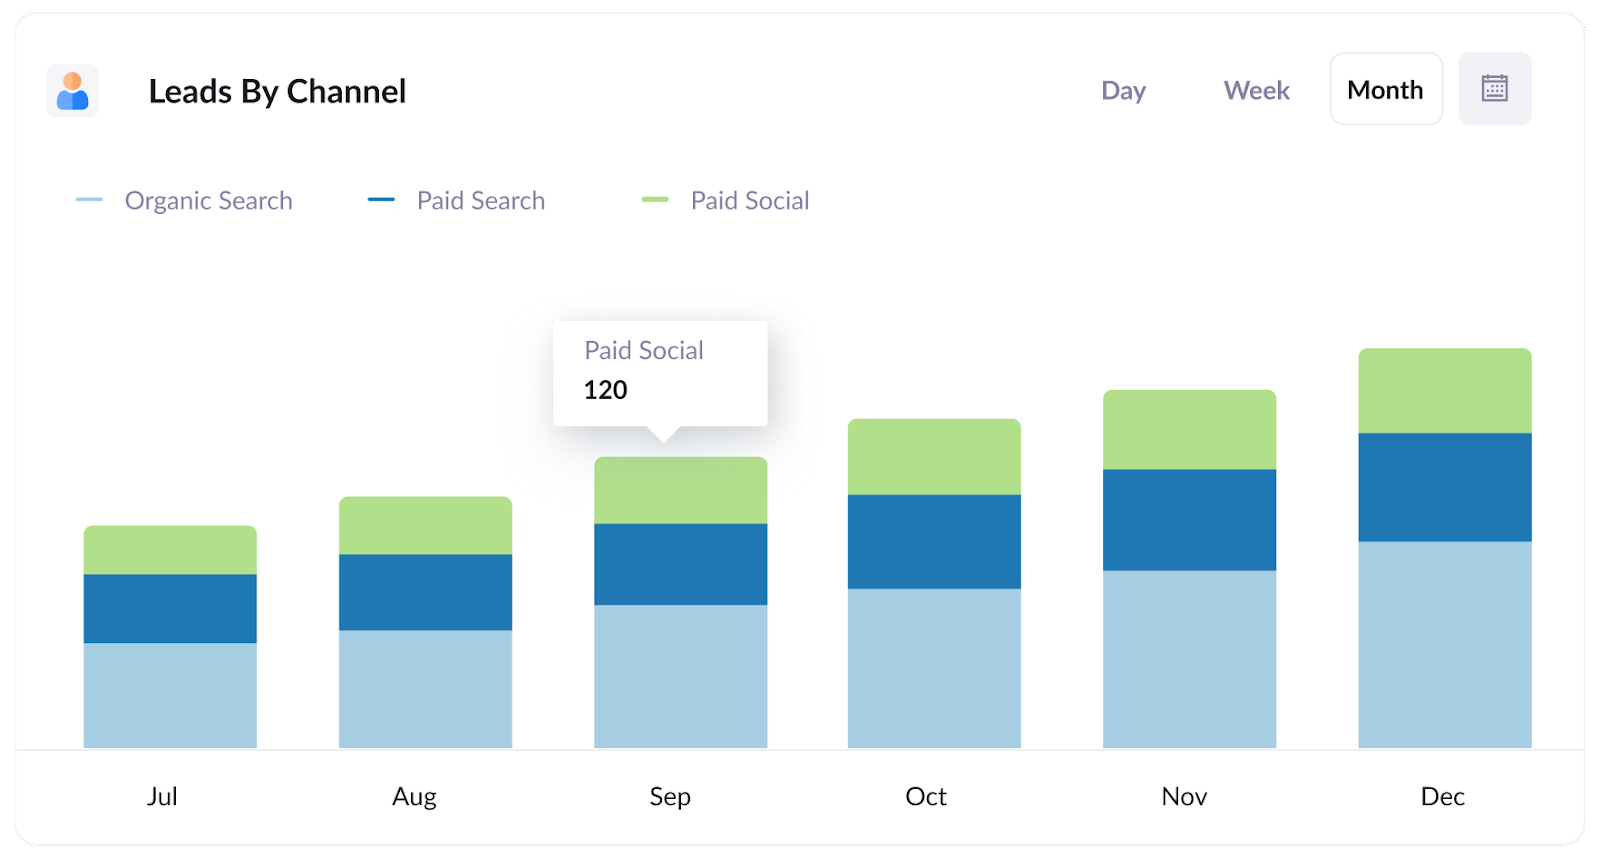
The above report shows the number of leads grouped by the channel they came from (I.e. Organic Search, Paid Search, Paid Social, Referral, etc)
This gives you a high-level overview of how many leads you are getting from each channel and can help you make top-level decisions on where to invest your marketing resources.
As an example, the above graph shows that the majority of leads are being generated by Organic Search and that it’s growing month over month, so it may be worth ramping up investment there as it seems to be working.
2. Deals by Landing Page Group
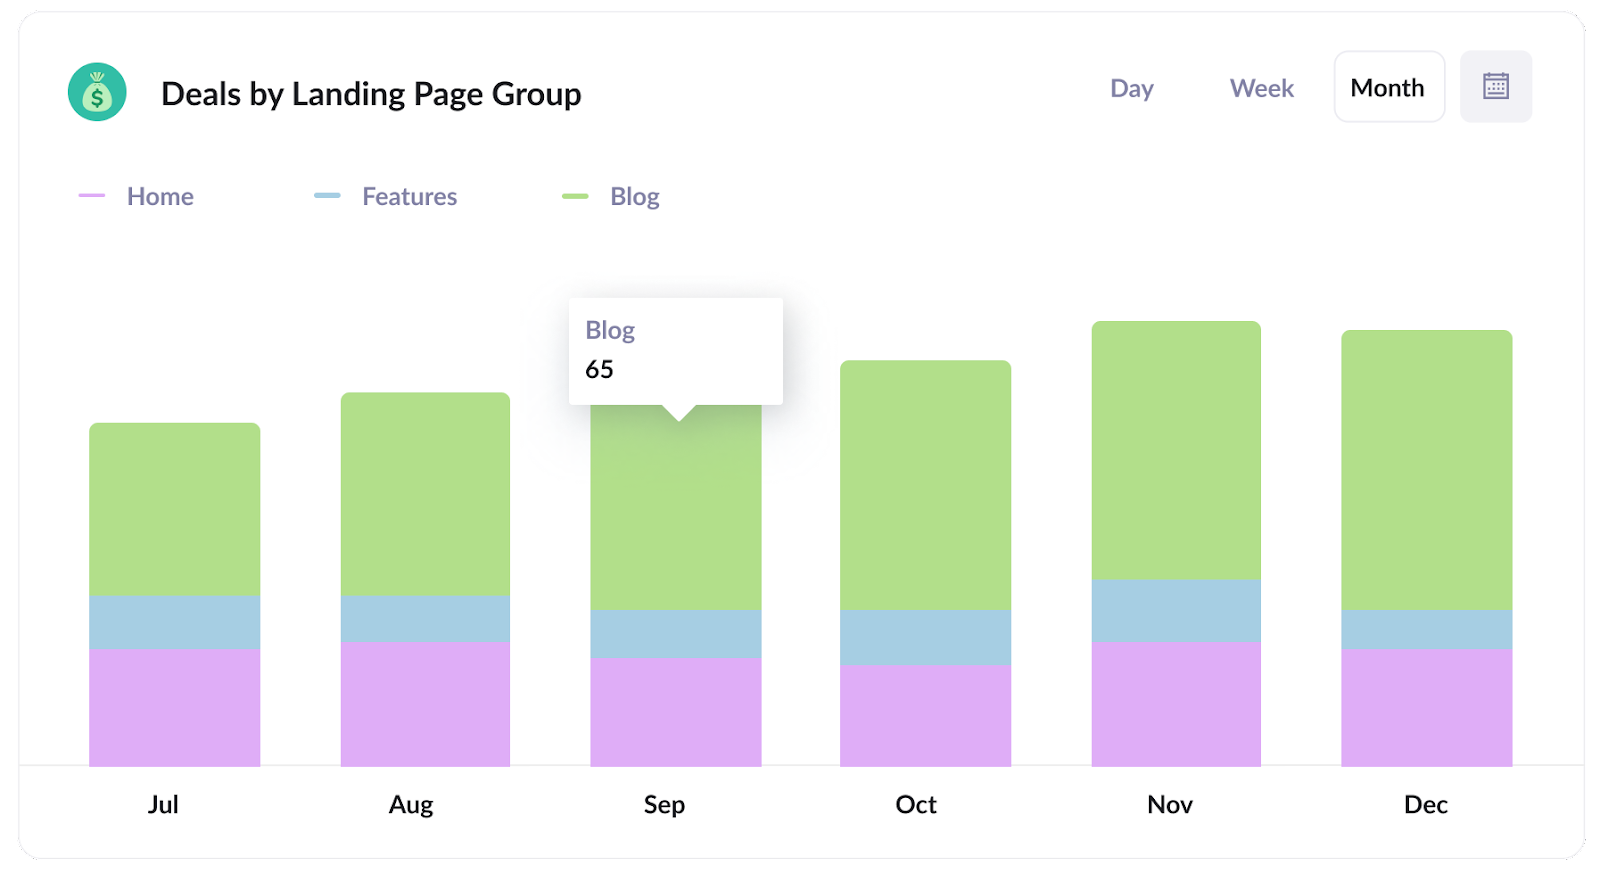
Have you ever wanted to know the ROI of your content marketing efforts (like your blog for instance)?
You can find out with this report, which shows the number of deals generated each month broken down by the content type that attracted them to your website (I.e. Homepage, Features, Blog, etc).
This can help you understand whether your blogging and other content marketing efforts are actually generating leads & customers for your business (as opposed to just generating website visitors) and you can even break it down to see which individual blog posts are performing best.
3. Customers by Google Ads Campaign
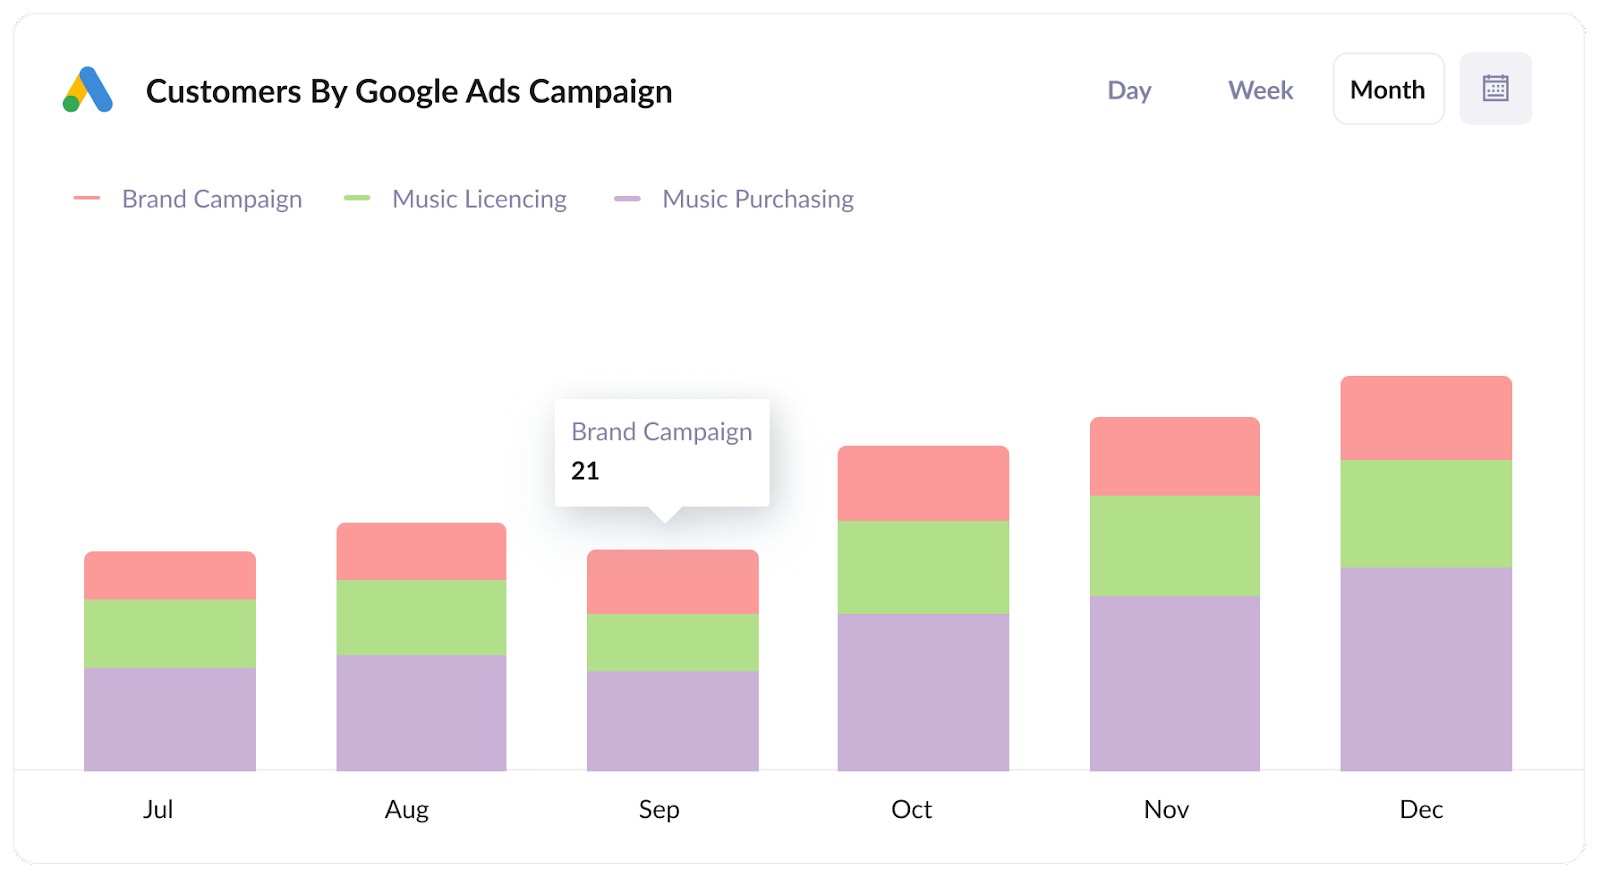
This report shows the number of new customers gained every month from Google Ads, broken down by the campaign they came from.
Running this report can help you see which campaigns are actually generating customers for your business and can help you to better allocate your Google Ads budget.
4. Revenue by Facebook Ads Campaign
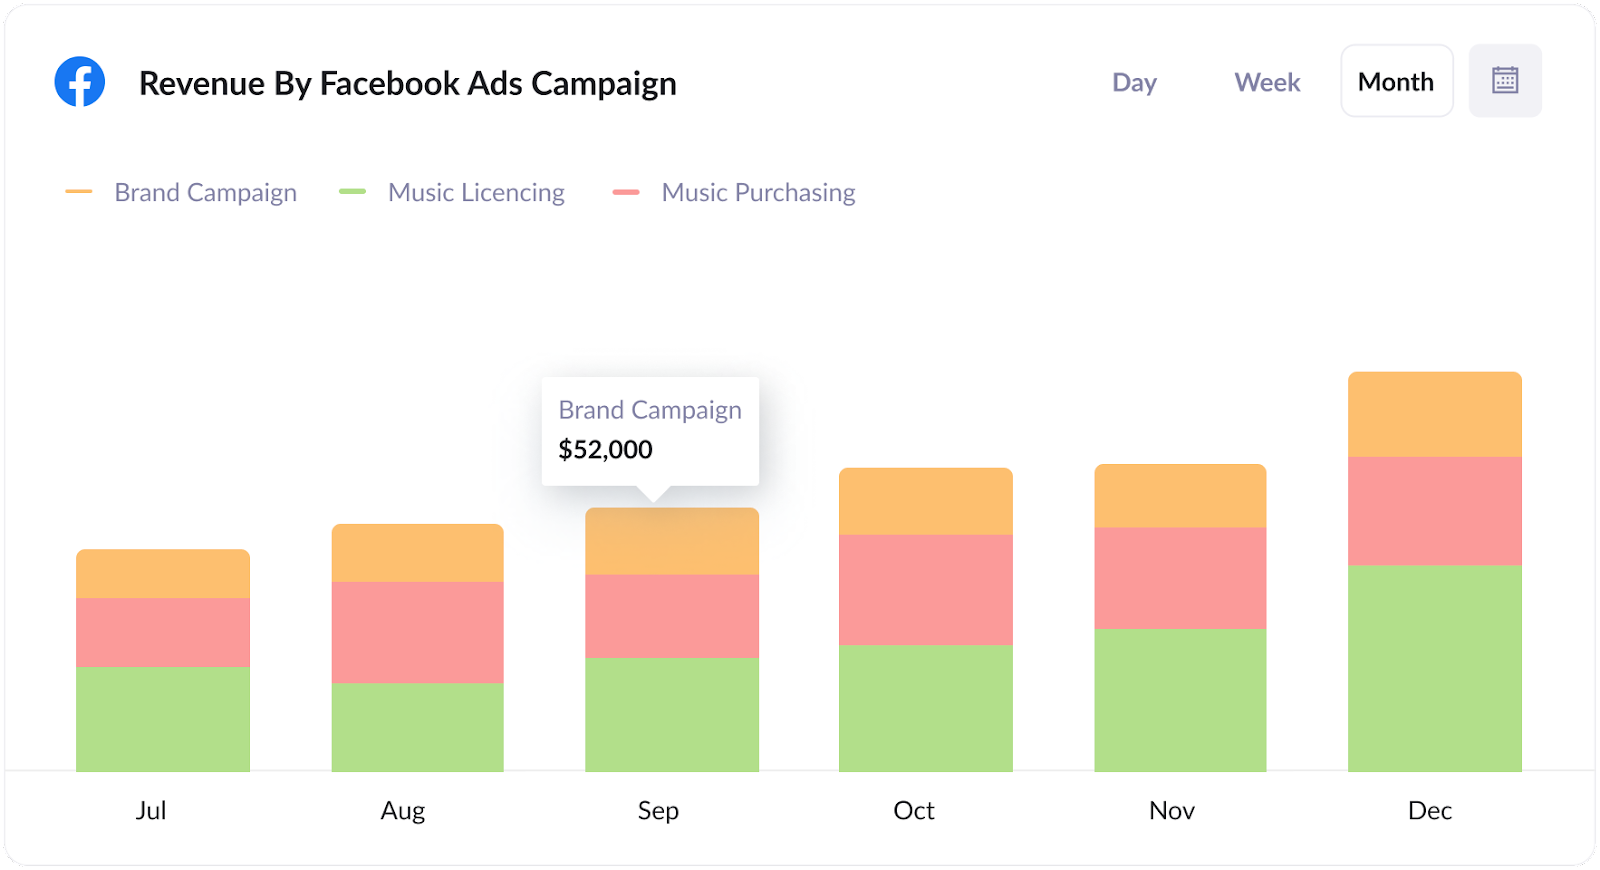
The above chart shows the amount of revenue generated from your Facebook Ads each month, broken down by the campaign they came from.
Running this report can help you understand whether the money you are investing in Facebook Ads is worth it. For instance, in the report above we can see that in September we closed $52,000 in new business deals from the Brand campaign. If we spent less than this on that campaign, then it’s a positive ROI and likely worth investing further in.
Wrap Up
If you just have Google Analytics installed on your website and are only looking at the number of visits to your website from different channels, then you’re likely missing the full picture of what marketing campaigns and initiatives are actually generating leads, customers & revenue for your business.
So if you want to truly understand how to drive growth, use tools like Attributer.io to capture information on where your leads are coming from and send that data into Nimble. You’ll then be able to run reports (like those above) that show exactly which campaigns & channels are driving revenue growth, and you’ll know what you need to do more of to grow.
Try Nimble for Free!
If you do not have a Nimble account yet, we invite you to try it for free for 14 days.
Stay tuned for more product announcements as we evolve Nimble into the best CRM for Microsoft 365 and Google Workspace Teams.