-

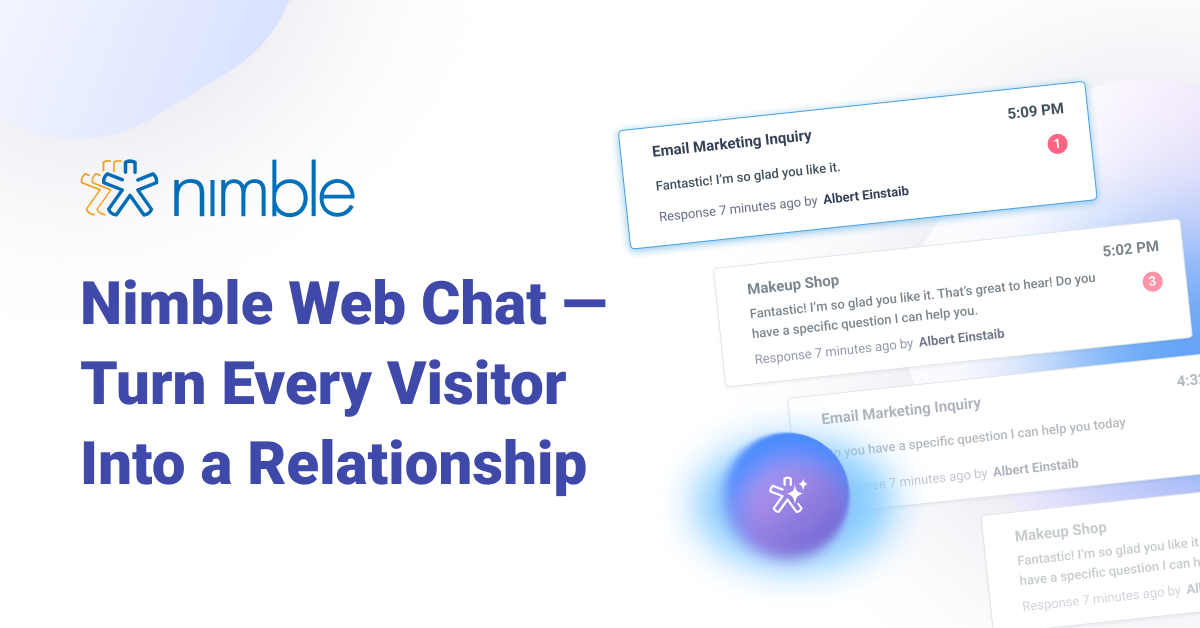
Real-time chat that turns every visitor into a contact — automatically, in your CRM, with no Zapier and no extra tools. Bundled with Web Forms for $12/month. Right now,…
Sales
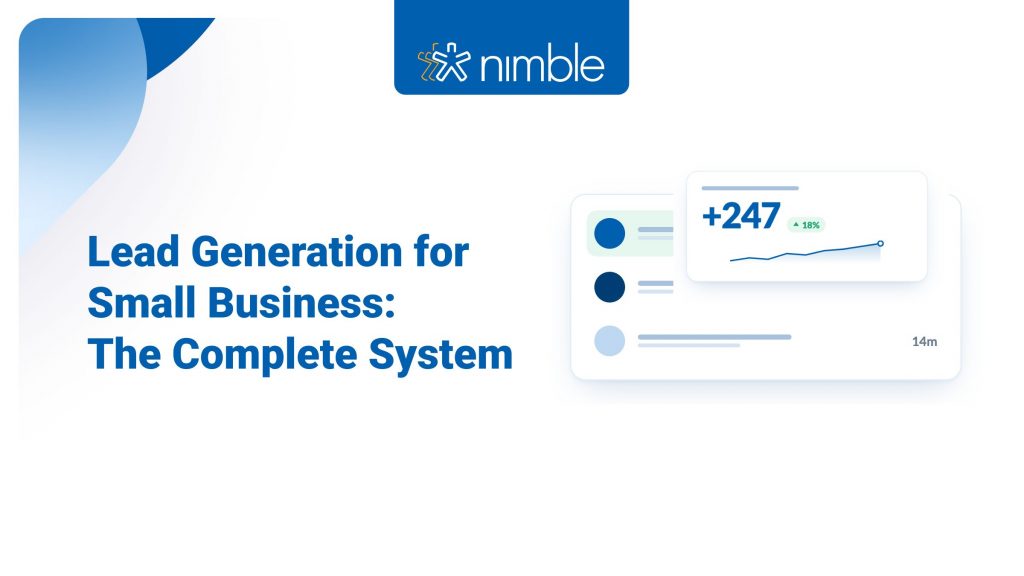
Lead Generation for Small Business: The Complete System
Most small businesses don’t have a lead generation problem. They have a system problem. Leads…
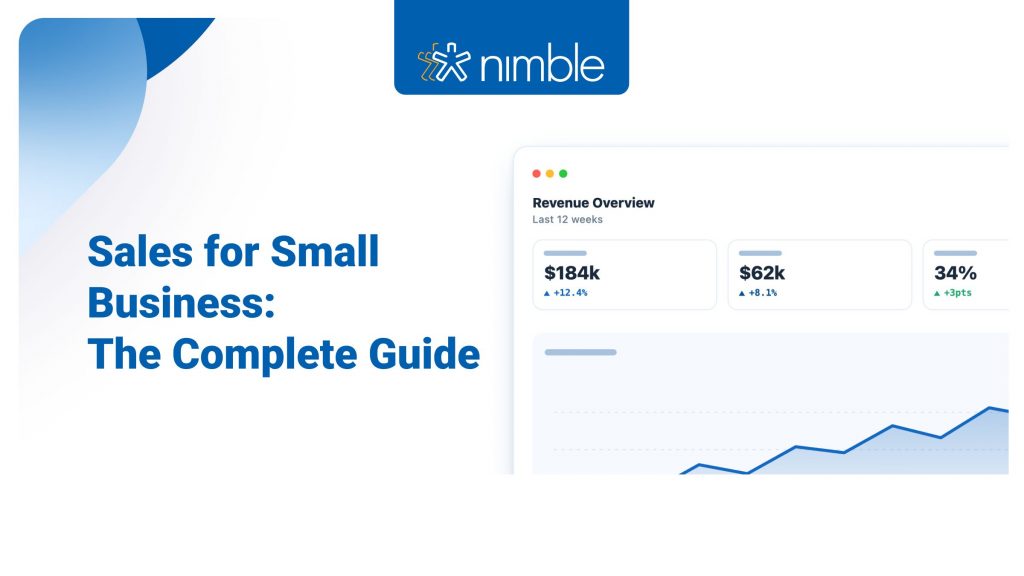
Sales for Small Business: The Complete Guide
Most small business sales advice is written for enterprise teams with a dedicated SDR, a…
Subscribe to Our Blog
Get the latest posts in your email
Product Updates
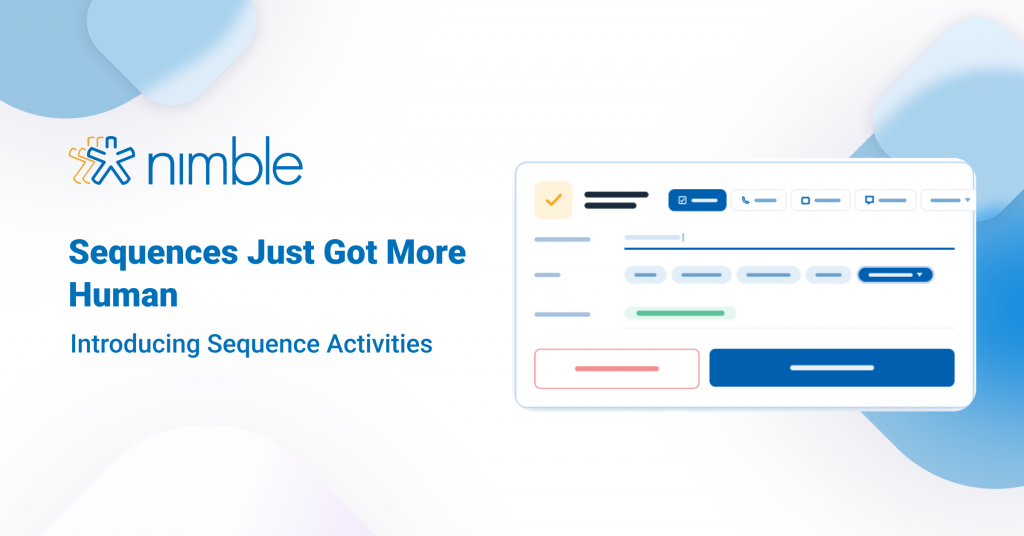
Sequence Activities: Sales Sequences That Actually Work
Inboxes are saturated. Templated emails get spotted in two seconds. The teams winning in 2026…

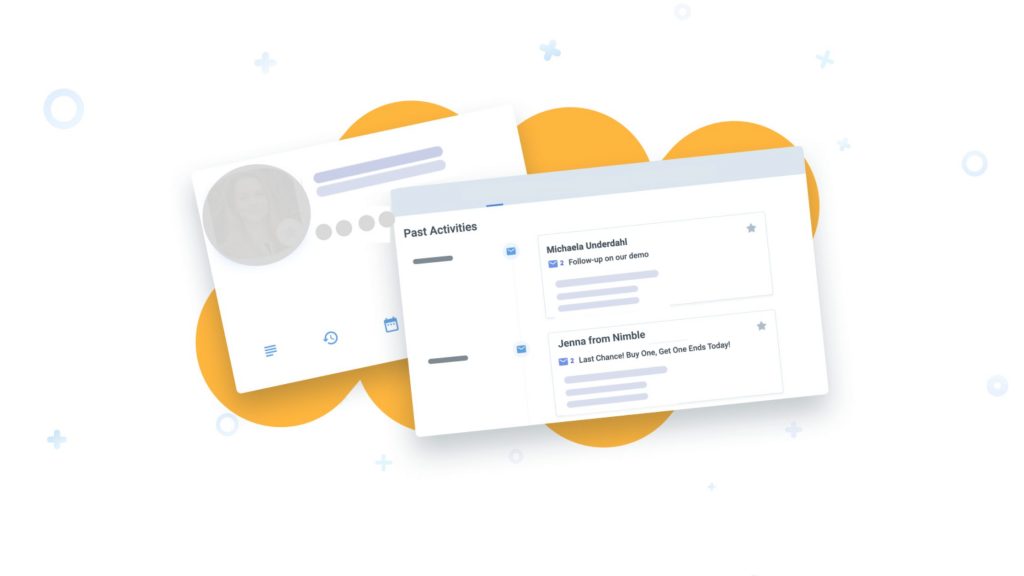
Your Website’s Quietest Conversations Just Got Loud — Nimble Web Chat Is Live
Real-time chat that turns every visitor into a contact — automatically, in your CRM, with…
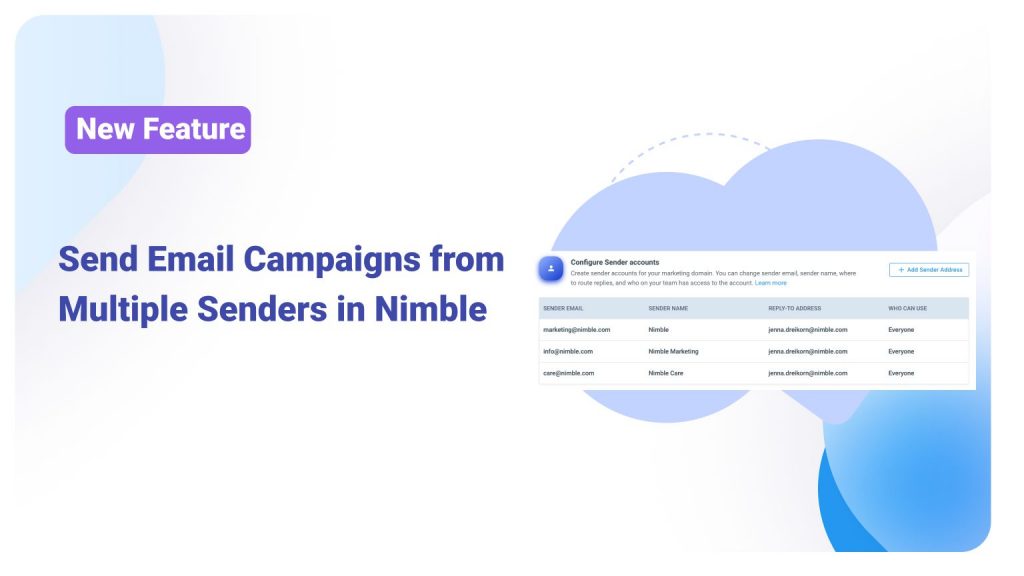
Send Email Campaigns from Multiple Senders in Nimble
Most teams use email marketing for more than one purpose. They send product updates, sales…
CRM
Best CRM Practices for Remote Sales Teams (2026 Playbook)
Remote selling is now the default, not the exception. Industry estimates suggest that the large…
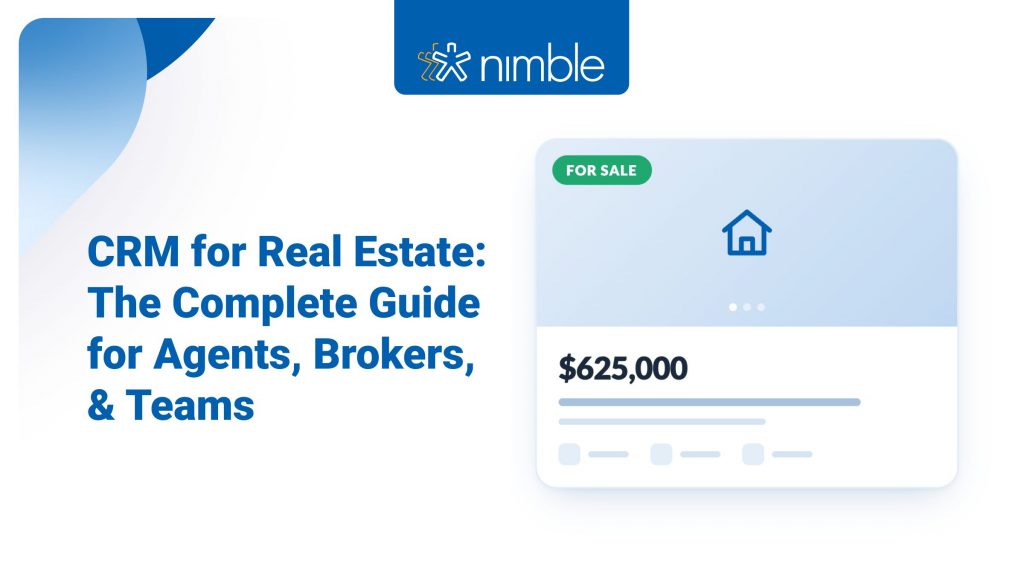
CRM for Real Estate: The Complete Guide for Agents, Brokers, and Teams
Real estate runs on relationships. The agent who stays in front of the right people…
Why CRM Tools Fail — And How to Fix the System Behind Them
Buying a new CRM doesn’t fix a broken sales process. It gives the broken process…
Marketing
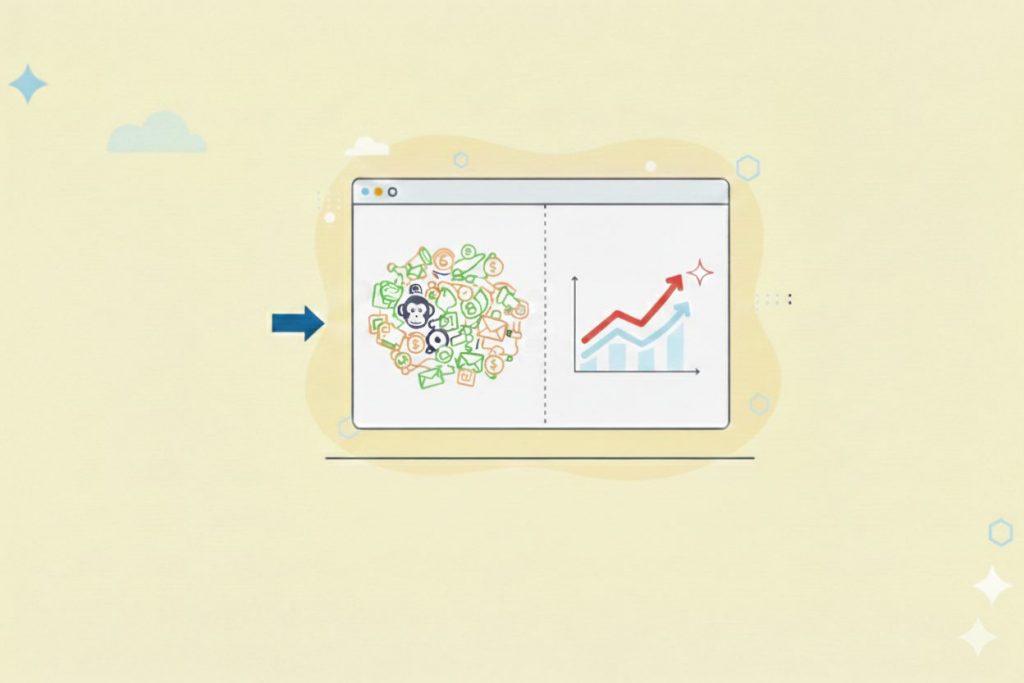
CRM + Email Marketing vs. Separate Tools: Why Integration Always Wins
Choosing an integrated CRM and email marketing platform is the fastest way to stop wasting…
Nimble vs. MailChimp: Ending the Email Marketing “Frankenstack”
When teams evaluate Nimble vs Mailchimp, they’re often comparing email marketing features rather than the…

What’s the Difference Between Personal and Professional Email Domains?
When you’re sending outreach emails, newsletters, or marketing campaigns, the domain you send from plays…
Customer Stories
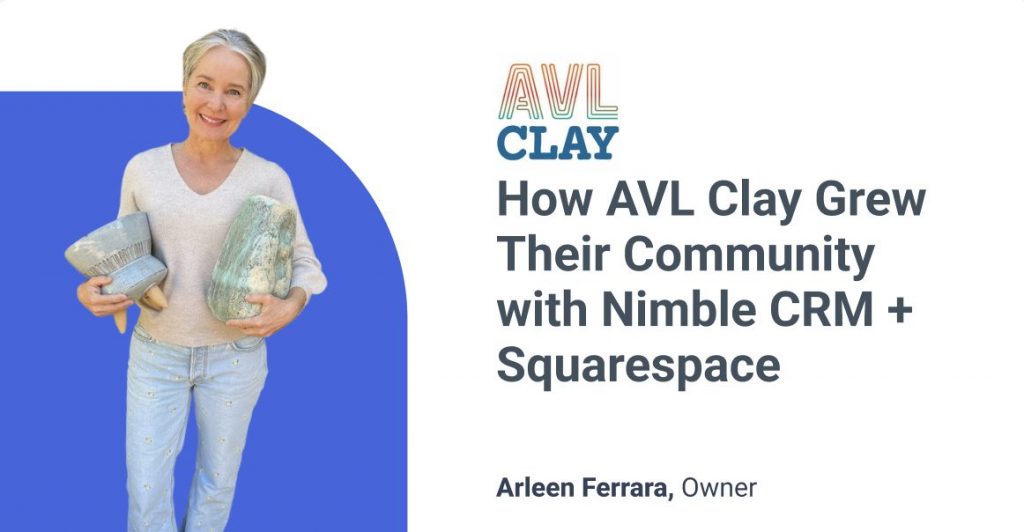
How AVL Clay Kickstarted Their Pottery Studio and Grew Their Community Affordably with Nimble CRM + Squarespace
When Arleen Ferrara opened her new pottery studio, she had three main goals: Bring awareness…
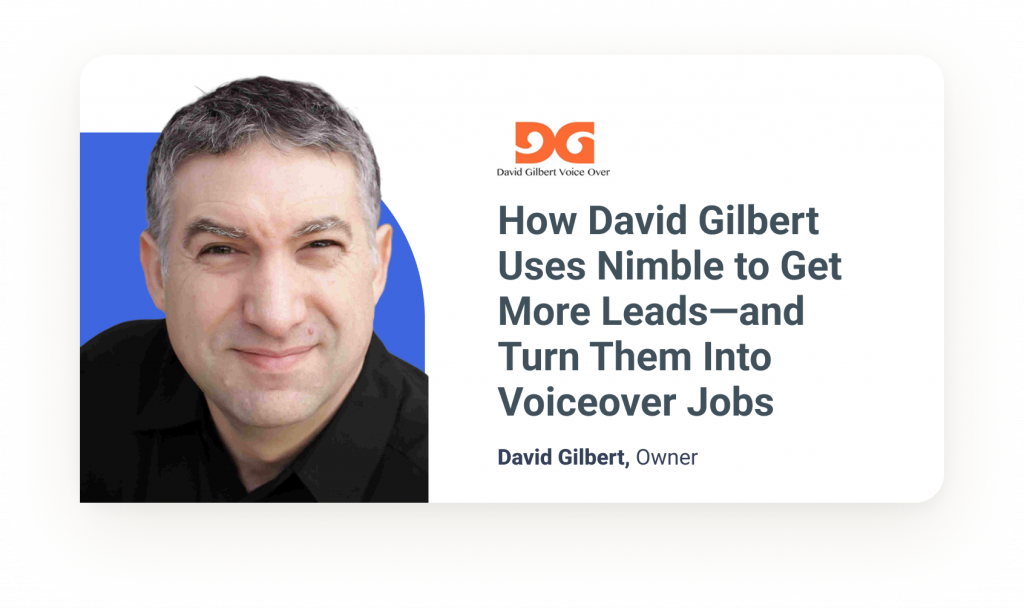
How David Gilbert Uses Nimble to Get More Leads—and Turn Them Into Voiceover Jobs
Name: David Gilbert Industry: Voiceover / Creative Services Use Case: Client Outreach, Relationship Management, Follow-Up…
Saunders Real Estate Sees 2x Growth with Nimble CRM
Names: Sid Bhatt and Trace LinderIndustry: Commercial Real EstateUse Case: Lead Management, Email Marketing, Deal…