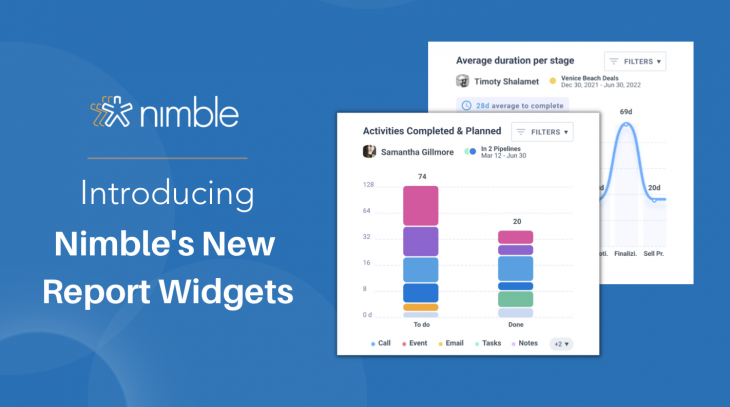
We are delighted to announce that Nimble launched three cutting-edge Deal Report Widgets as part of our most recent Deals and Reports rollout. These novel Deal Reports seamlessly integrate with our New Deal Reports Dashboards, Deal Reports Widgets, and New Deal Pipelines, providing vital insights into Scheduled and Finished Activities, Average Deal Worth, and Average Duration Per Stage. In this post, we will examine each of these reports in more detail and discuss their importance to your business.
Our new Nimble Deal Reports enable management to track their organization’s sales performance with ease. Nimble automatically pulls the information from Deals to help you save time and make better business decisions. Nimble has now added three additional deals reports widgets to gain valuable insights on more sales reports that matter.
For our legacy users, to view our new deals and reports, migrate your legacy deals to Nimble’s New Deals by following these steps.
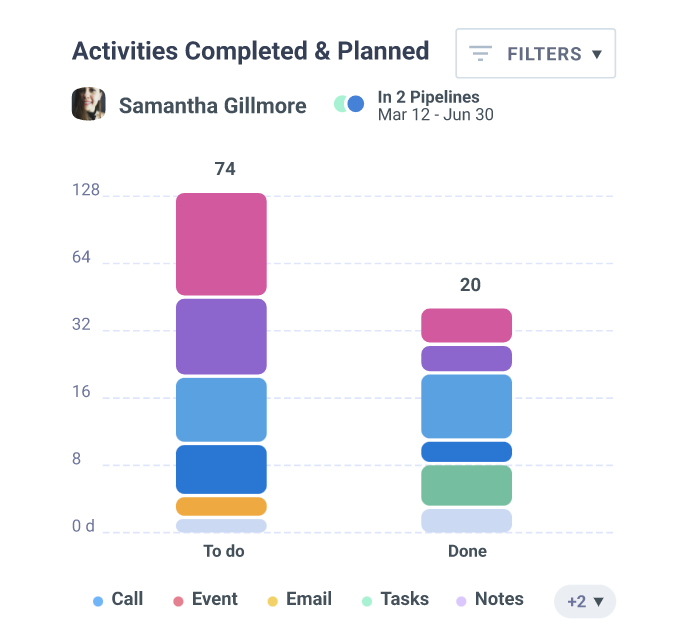
The Activities Completed and Planned Report is a powerful tool that helps you monitor your progress by showing you all the tasks you have completed and those that are still pending. With this report, you can quickly identify your daily priorities, set achievable goals, and keep track of your progress toward meeting them.
To use your reports effectively, it is essential to understand how it works. Typically, the report is generated by selecting a specific time range, such as a day, week, or month, and specifying the user or group whose activities you want to track. Once the report is generated, it displays all the completed and planned activities of the chosen users within the specified time frame.
Tracking your average deal value is a valuable tool that helps you understand the average value of your deals, which can help you identify trends, set achievable goals, and make informed decisions about your sales strategy.
Typically, the report is generated by choosing a specific time range and specifying the user whose deals you want to track. Once the report is generated, it displays the average value of the chosen users’ deals within the specified time frame of the chosen user.
The report is a powerful tool for identifying trends in your sales pipeline. By analyzing your average deal value, you can identify whether your deals are increasing, decreasing, or remaining consistent over time. This information can help you adjust your sales strategy accordingly, such as focusing on high-value deals or finding ways to increase the value of your existing deals.

Per Deal Stage
The Average Duration per Stage report comes in handy by helping you identify bottlenecks in your sales process and optimize your Deals pipelines for greater efficiency. Keeping track of how long deals spend in each stage of your sales pipeline brings you closer to perfecting your sales strategy and setting realistic targets for closing deals. By understanding how long deals typically spend in each stage of your sales pipeline, you can set achievable goals for yourself or your team.
Once the report is generated and filtered, it displays the average duration that deals spend in each stage of your sales pipeline. The report is a valuable tool for identifying bottlenecks in your sales process. By analyzing the average duration per stage, you can identify which stages are taking the longest and why. This information can help you make informed decisions about how to optimize your workflow and reduce the time it takes to close deals.

Your Reports Page
You know how important it is to have accurate data about your deals. But what if you’re just getting started with Deals and Reports and don’t have any real data yet? That’s where sample data comes in. Adding sample data can be incredibly helpful for getting insights on your deals reports. This data can help you test different report configurations, and get a sense of how the system works.
To turn on the sample data, you must be the account owner. From here, you can turn on your sample data to your account simply:
- Go to your onboarding tab on your dashboard
- Click the orange toggle button next to “sample data”

We have many more exciting new features heading your way this year including interactive Deal Reports that enable you to “Click Into Deal Graphs” to display the contacts related to sub-sections of the graphs!
Be sure to keep an eye out for more Deal reports including activities vs. Deals and Sales Leaderboards, Nimble Deal Automations, and much more!
Thank you to our Nimble customers as many of our product updates were created at the request of our fantastic Nimble Community!
Keep an eye out for upcoming Nimble Updates and don’t forget to read about our latest updates by checking out our Product Updates Blog!
For a complete Nimble’s Reports Feature Overview, feel free to read our Nimble Reports Overview Support Article.
If you have any questions, please write to us at [email protected], initiate a chat from this FAQ, or join one of our Nimble Onboarding and Best Practices sessions, held every weekday at 9 AM PT.