When I began creating marketing dashboards earlier in my career, the effort was a manual and cumbersome process.
As a result of the Herculean effort required in gathering and analyzing the data and producing a dashboard, it was vital to focus on the most salient information that would facilitate strategic decisions and demonstrate our marketing department’s contribution to the business’s bottom line.
Today, the flow of data is never-ending and affordable analytics tools are easily acquired.
With one click, nearly every MarTech tool and system will produce a pretty report chock-full of data. This is where marketing can trip itself up.
When your dashboard is mired with tons of data, you risk a poor signal-to-noise ratio.
 When the signal-to-noise ratio is poor, your signal (in this case your salient information) gets lost in the noise – all the background data.
Signal-to-Noise Ratio: What is it?
Signal-to-noise ratio comes from the domain of engineering and science. It measures the ratio of the strength of a signal to its background noise.
In any form of communication, the end goal is to make sure your signal is received. Marketing is no different. When your dashboard is overloaded with data, the signal can become diluted by the random noise generated by superfluous or irrelevant data.
From spending a great deal of my career among engineers, I learned the importance of being able to separate relevant and irrelevant data. This was especially true when it came to the monthly marketing report: The business leaders for my organization preferred no more than six charts for the monthly report. Each chart needed to be relevant and actionable.
Before going through how to make sure your marketing dashboard meets both of these criteria, let’s explore how to reduce the SNR.
It’s All About Choosing the Right Data
It’s easy to get bogged down with data, or the “noise.” That’s why it’s important to remember that any dashboard, whether for marketing or another function, needs to answer the proverbial question: so what?
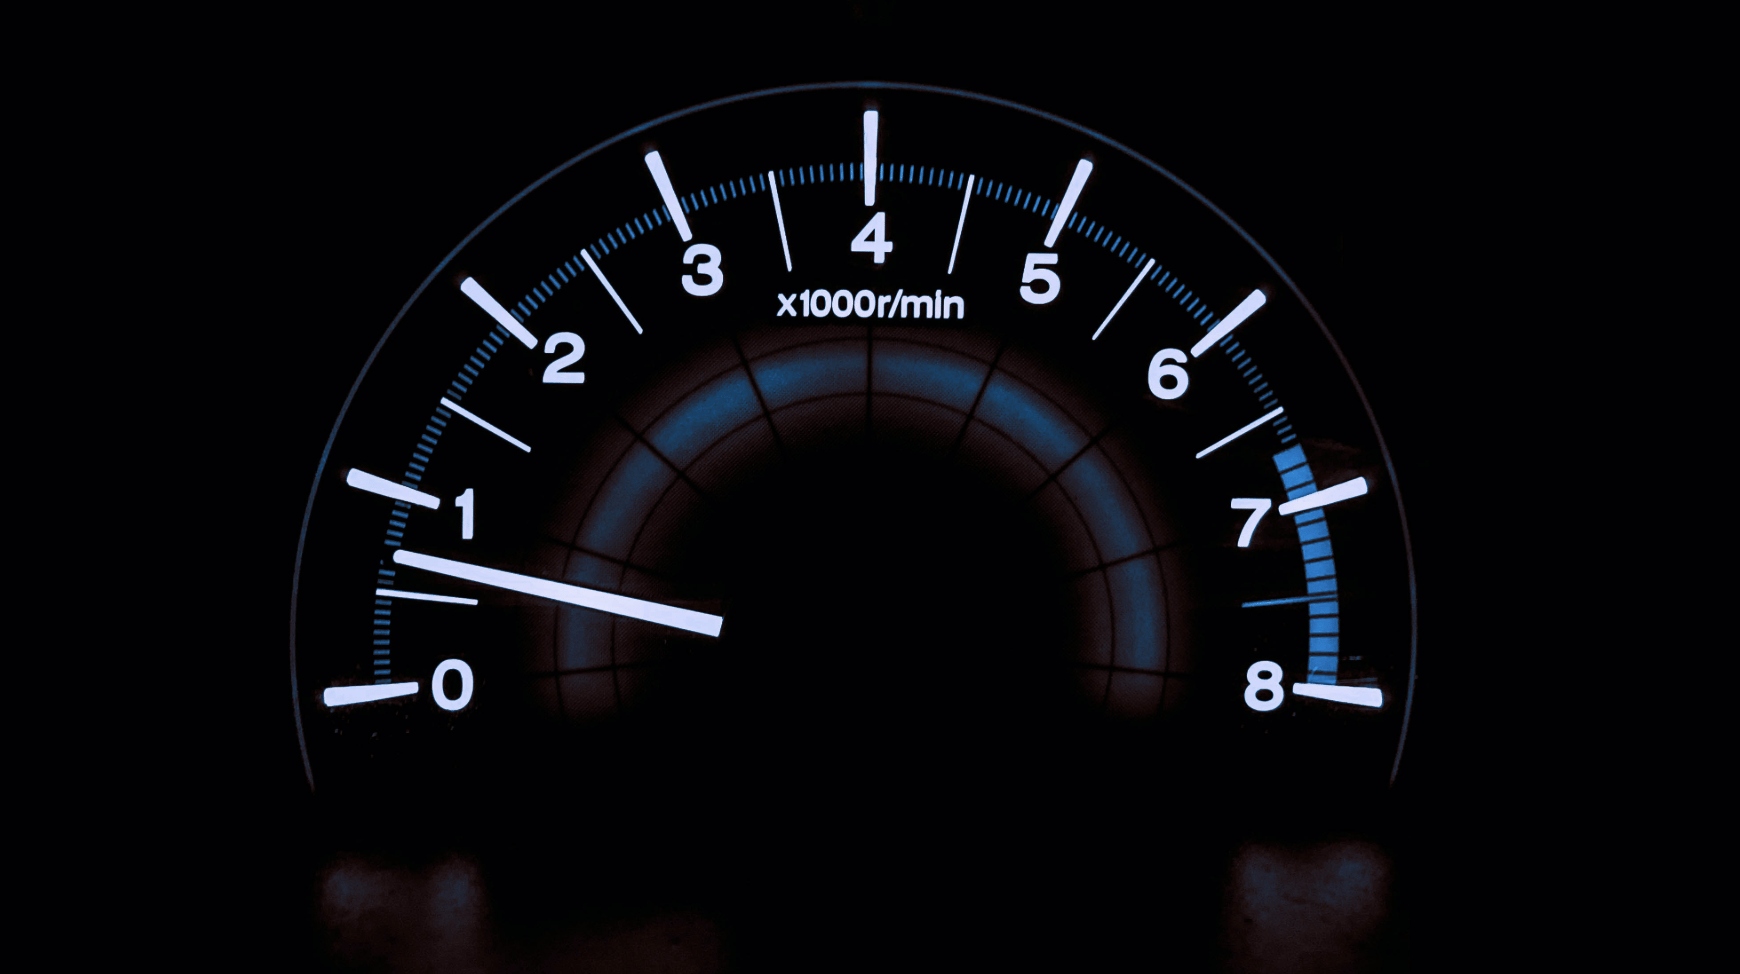
If it does not facilitate an action or a decision, what then is the purpose of your dashboard? Think about the dashboard of your car – there is a lot of data, but it all serves a specific purpose. The speedometer lets you know what your speed is so you can decide whether to stay within the speed limit. Your fuel gauge lets you know how much fuel you have so you can decide if you need to refuel now, or later. Your average-miles-per-gallon data gives you information so you can decide whether you’re receiving enough value for your money.
Reducing the amount of data, or lowering the noise level, does not necessarily produce a higher-quality dashboard. You just need to make sure you have the right data. At a minimum, the best marketing dashboard includes data that helps the leadership team know:
- Which business outcomes marketing is impacting, and to what degree.
- Whether marketing is meeting its performance targets and what levers can be pulled to achieve them.
- What tactical course adjustments (if any) need to be made.
- What strategic decisions need to be made related to customers, products, and competitors.
- Is there any potential risk, and if so how great is it?
If you want to improve your signal-to-noise ratio, you must understand what decisions and actions are needed. Then select only the data for your dashboard that are relevant to these.
How to Improve the Data on Your Dashboard
You’ve probably noticed a lot of emphases on real-time dashboards. Whether it’s website traffic, social media engagements, email opens, or click-through rates — you can bet there’s a real-time dashboard for it.
Like many other business teams, we’re guilty of using these incessantly. If we’re not careful, we can spend way too many hours monitoring our website traffic and social media activity as it occurs. However, real-time dashboards can actually be harmful, increasing the noise level and causing knee-jerk reactions.

Tracking and reporting on data over longer periods help to make these determinations and enable you to clear out the noise. It can also help you identify acceptable parameters and define alerts, similar to the way your fuel gauge alerts you that it’s time to refill the tank when you’re low.
For this approach to your dashboard to work, you will need to smooth out your data. While there are a variety of sophisticated statistical techniques you can use to smooth out data, a simple moving average that weights past as well as current numbers offer a relatively easy way to assess trends.
Growth in terms of customer number and purchases can be examined in the context of a defined window, like the 12-month trailing moving average. When you are in a market that experiences frequent peaks and valleys, your growth trend provides a more accurate picture.
When you have a high frequency of data (such as win/loss, net new opportunities, and other pipeline metrics) that can bounce around with huge swings in both directions, reducing the noise by averaging this type of data over time is vital.
Combine Multiple Indicators
Another way to reduce noise is to combine multiple indicators, even when they measure somewhat different concepts. For example, combining different measures of a similar concept around spend and costs per, such as cost/new customer, the cost to serve, and so on.
There are conceptual differences among these, so even if they were measured perfectly they would still track differently. By combining these measures, you can build a better picture of the underlying trend related to value for money. Combining measures of the same concept to improve an estimate is also helpful. There’s the added benefit of trending your data. You’re able to contextualize and begin to understand the underlying drivers you can impact.
Conclusion
Whether it’s the dashboard in your vehicle or a business dashboard, dashboards serve as valuable decision support tools. Too many measures confuse the interesting with the important.
Always remember to assess your current dashboard to determine whether reducing the noise might help you hone in on the key signals you need to make course adjustments, mitigate risk, increase your value to customers, and improve business performance.