For many organizations, marketing’s primary role in maximizing the pipeline equation is to add as many qualified opportunities – those most likely to close – to the pipeline as possible (leads). So it’s no wonder that Marketers tend to rely upon a variety of common lead-related metrics, such as cost per lead, lead volume and lead quality – to measure their customer acquisition effectiveness. However, limiting marketing’s metrics to “leads” actually does both marketing and the organization a disservice. Learn what other pipeline-related metrics marketing should employ to facilitate better activity and investment decisions.

One of marketing’s top priorities is finding and helping the organization acquire new profitable. To achieve this objective marketers create or perform market segmentation, customer buying process maps, personas, and sync content, touch points, and channels. The various buying process maps reveal the behaviors associated with each customer’s buying stages, such as what behaviors reflect the contact vs. connection, vs. conversation, vs. consideration, and ultimately the consumption stages. These stages serve as the basis for how marketing and sales will collaborate and frame the opportunity pipeline in terms of marketing qualified opportunities, often referred to as MQLs.
Once the framework is defined, Marketing and Sales work together to maximize the opportunity pipeline in order to meet the organization’s revenue targets. Revenue (R) is equal to the number of opportunities in the pipeline (Pipe Opp) multiplied by the average deal size (Avg Deal) multiplied by the win rate (Win Rate), divided by sales cycle time. This equation is expressed as follows:
R = (Pipe Opp x Avg Deal x Win Rate) / Cycle Time
A small change in any of these variables can have a significant impact. The more closely Marketing and Sales are aligned, the more likely it is that each of these factors can be improved upon, thereby increasing both the company’s revenue and the rate at which the revenue is generated. Both teams play critical roles in the development of a successful pipeline.
For many organizations, marketing’s primary role in maximizing the pipeline equation is to add as many qualified opportunities (those most likely to close) to the pipeline as possible. While the nomenclature companies use to define the stages may vary, for our purposes we will refer to qualified opportunities that are sales-ready (as opposed to sales-worthy) “leads.” Let’s quickly differentiate between sales-ready and sales-worthy: sales ready qualified opportunities reflect buyers who have met the fit criteria and are exhibiting late stage consideration and early stage consumption behaviors that indicate they are prepared to make a purchase and therefore require sales engagement. Sales-worthy opportunities are those qualified opportunities that reflect buyers who meet the fit criteria and have demonstrated enough late-stage conversation and early stage consideration behaviors to merit nurturing by marketing until they are ready for sales engagement.
Because many organization see Marketing’s role in terms of qualified opportunities, it’s no marketers tend to rely upon a variety of common lead-related metrics, such as cost per lead, lead volume and lead quality – to measure their customer acquisition effectiveness. However, limiting marketing metrics to “leads” actually does both marketing and the organization a disservice.
Let’s use an example to help illustrate this point. Imagine you have two new customer acquisition programs in play: Program Excalibur produces 100 qualified opportunities and Program Camelot produces 50 qualified opportunities. Using the data from the following chart we can see why it is important to consider other metrics when making program investment decisions.
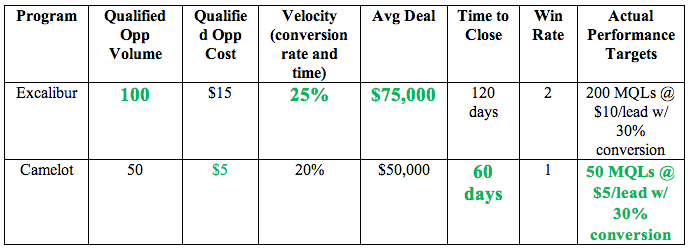
At first glance, it might appear that based on volume or the quantity of qualified opportunities, that Excalibur is the better program. For the moment, let’s put aside whether each program met its performance target and explore why just tracking the number of qualified opportunities may lead us down the wrong path – pursuing Excalibur and terminating Camelot.
First let’s look at the cost per opportunity because most marketers would agree that cost is an important metric. For our purposes, the cost per qualified opportunity for Excalibur is $15. For Camelot it is $5. Again, ignoring for the time being whether these costs were within the target zone, now it might seem that Camelot is worth further investment because while it didn’t produce as many opportunities, it produced quality opportunities less expensively. Do we have enough data to make the decision? Not yet. What if we added conversation rate as a metric to the equation?
Of the 100 qualified opportunities produced by Excalibur, 25 (25% of 100) convert to sales conversations but for Camelot only 10 convert (20% of 50). To keep things simples, let’s say both programs have the same close/win rate of 10%. This results in 2 deals (10% of 25 sales conversations rounded down) for Excalibur and 1 deal for Camelot (10% of 10). With this additional data Excalibur once again looks like the champ.
What if we now add velocity to the equation? Upon analysis we learn that Excalibur opportunities took 30 days on average to move to the sales conversation stage and 90 days on average to the customer stage, for a total of 120 days in the sales cycle. But it took only 15 days for Camelot connections to convert to sales conversations and only 45 days on average to convert these prospects to customers (consumption stage), for a total of 60 days. This means that the time and cost to close is less for Camelot deals than Excalibur deals. So now Camelot is squarely back in the game.
Now let’s weave in another data point. The average order/deal value for Excalibur is $75,000. For Camelot it is $50,000. Excalibur is once again back in the lead.
Lastly, we must also consider the actual performance targets which were set for each program. For this program, the performance target for Excalibur was 200 qualified opportunities at $10/opportunity with a 30% conversion rate and for Camelot 50 qualified opportunities at $5/opportunity with a 30% conversion rate. Camelot actually did a better job of meeting its performance targets, so if we can improve the conversion rate for Camelot deals and raise the average order value, Camelot would perform better and be worth additional investment compared to Excalibur. However, had we made our decision solely based on lead-volume then we might have prematurely dismissed Camelot.
This example illustrates how examining metrics beyond lead volume and looking at metrics that comprise the entire revenue equation, marketing can make better investment and activity decisions. In addition to qualified opportunity volume and cost/qualified opportunity as ways to evaluate marketing’s contribution, value and impact, marketers should consider adding the following pipeline related metrics:
Pipeline contribution: the number of qualified opportunities generated by Marketing that convert into sales opportunities and ultimately into new deals. This metric helps ascertain to what extent marketing programs and investments are positively effecting the win rate and reducing the number of qualified leads that wither and die or are rejected by Sales.
Pipeline movement: the rate at which opportunities move through the pipeline and convert to wins. This metric helps assess the degree to which marketing programs and investments accelerate the sales cycle.
Pipeline value or volume: the aggregate value of all active opportunities at each stage within the pipeline. This helps determine what increase in potential revenue marketing investments may generate.
Pipeline velocity: These first 3 metrics along with the average revenue per sale and the average sales cycle time, can then be used to calculate pipeline velocity, which measures the rate of change within your pipeline—both in speed and direction. This enables you to determine whether your sales rate is accelerating, decelerating, or remaining constant.